Abstract
The Digital Universe, which consists of all the data created by PC, Sensor Networks, GPS/WiFi Location, Web Metadata, Web-Sourced Biographical Data, Mobile, Smart-Connected Devices and Next-Generation Applications (to name but a few) is altering the way we consume and measure IT and disrupting proven business models. Unprecedented and exponential data growth is presenting businesses with new and unique opportunities and challenges. As the ?Internet of Things? (IoT) and Third Platform continue to grow, the analysis of structured and unstructured data will drive insights that change the way businesses operate, create distinctive value, and deliver services and applications to the consumer and to each other. As enterprises and IT grapple to take advantage of these trends in order to gain share and drive revenue, they must be mindful of the Information Security and Data Protection pitfalls that lay in wait ? hurdles that have already tripped up market leaders and minnows alike.
Introduction ? The Digital Universe
Welcome to the Digital Universe. ?Growing at 40% a year and into the next decade (IDC 2014: 1)? it comprises not only the ever-expanding number of end users and enterprises which now do almost everything online, but also a raft of diverse smart devices which make up the fledgling but rapidly evolving IoT ? the ?Internet of Things.? The trend towards the digitisation of businesses and social networks, coupled with the increasing social mobility provided by smart devices such as smart phones and tablets, is seeing an exponential boom in the growth of structured and unstructured data. This provides unprecedented Big Data opportunities for organisations with the foresight to extract insight from ?third platform? mobile devices, social media and ?smart? internet-connected devices.
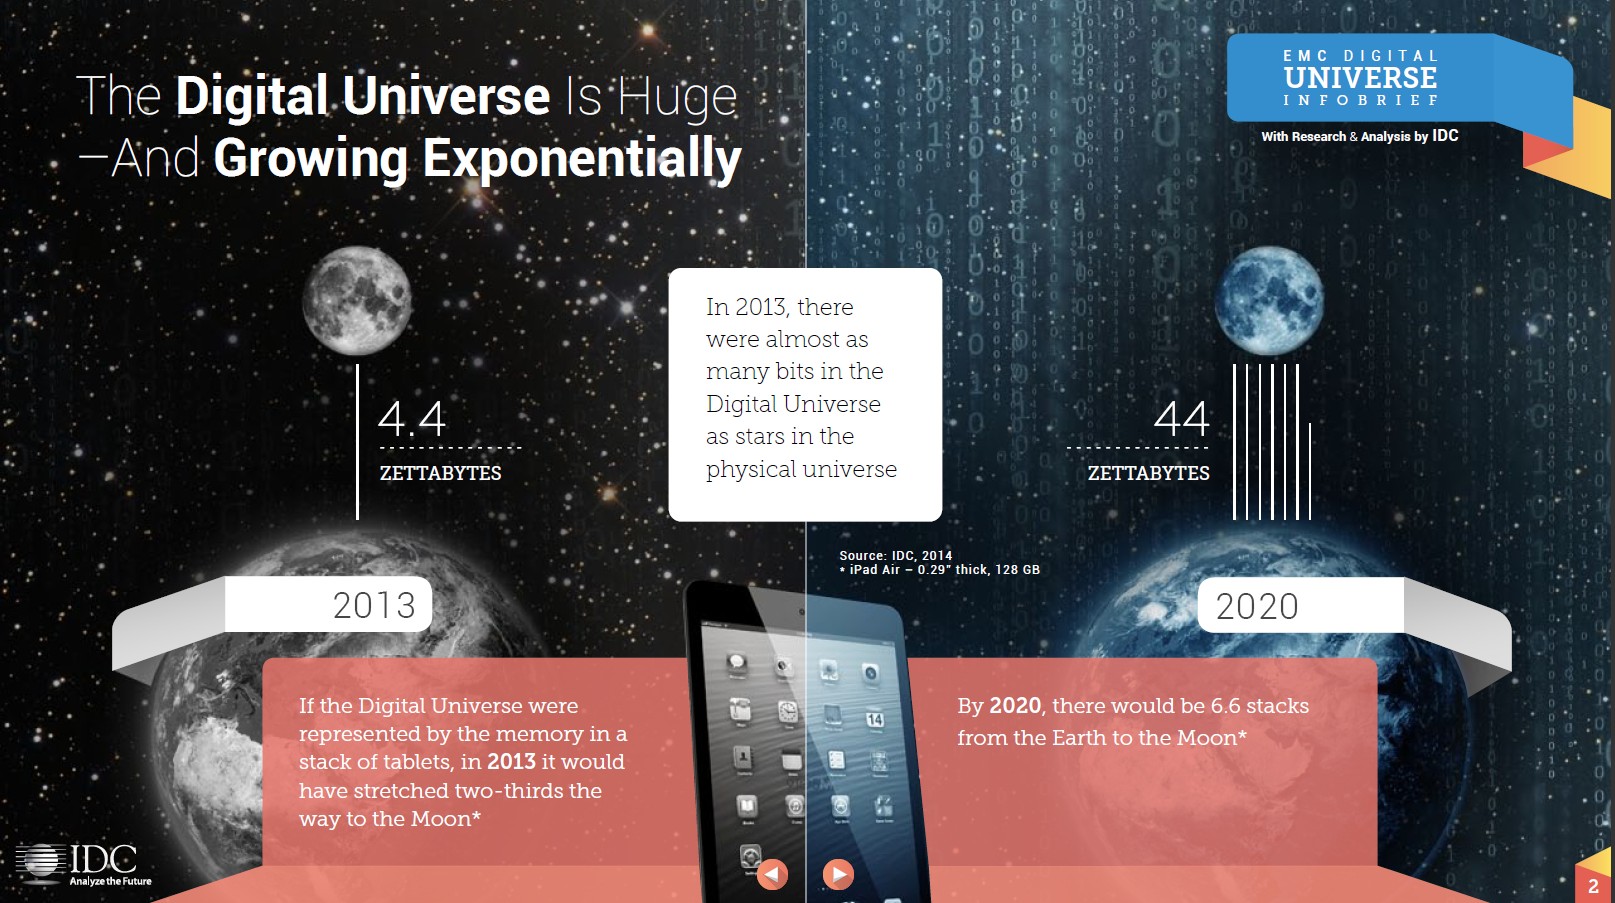
And just how much data growth are we likely to see? According to current estimates, by the year 2020 the internet will connect ?7.6 Billion people and 32 Billion ?things?? (IDC 2014a) all of which generate data. As a comparison, in the year 2000 the amount of Data generated totalled 2 Exabytes (2 x 1018 bytes). In 2011, 2 Exabytes were being generated every day. ?By 2013, there were 4.4 Zettabytes (or 4400 Exabytes) of total data stored, and by 2020, the total amount of data in storage is expected to reach 44 Zetabytes (IDC 2014a)? ? an astounding figure. Organisations that understand how to extract insight from this data will be in a position of strength.
Figure 1 ? The trend in the size of the digital universe. Source: (IDC 2014a: 2)
Structured and Unstructured Data
Gaining insight via data analysis is not as straightforward as it might seem. Unstructured data, the type generated via a tweet and which contains information about people?s opinions and thoughts, is far more difficult to analyse than structured data which resides in a fixed field within a record or file. Organisations that have the applications and infrastructure specifically designed to analyse both structured and unstructured data ? in concert and in real time ? will be able to drive efficiency in their business operations, better cater to their users? needs, create new value and respond with agility and speed in the application development lifecycle.
The Changing Data Landscape
Data growth will not be uniform across mature and emerging markets. As an example, ?in 2013 mature markets represented 60% of the Digital Universe. By 2020, the converse will be true, with emerging markets such as China, Russia, Brazil, India and Mexico set to represent 60%. Furthermore, the ties between consumer- and enterprise-generated data have never been stronger. In 2013, two thirds of all data was created by consumers with enterprises ?touching? or being responsible for 85% of the consumer data? (IDC 2014a).
The Internet of Things
As for the IoT, while its impact on total data generated will remain lower than that of consumers, ?it will still represent 10% of all data created in 2020, up from 2% in 2013? (IDC 2014a). The network-connected devices that make up the IoT are characterised by automatic provisioning, management, and technology and include intelligent systems and devices, connectivity enablement, platforms for device, network and application enablement, as well as analytics, social business and vertical industry solutions.
Mobility
A key driver in the Digital Universe, ?in 2014, mobile-connected devices accounted for 18% of all data. By 2020, that figure will grow to 27%? (IDC 2014a). Mobile devices don?t simply include your tablet or smart phone. RFID tags, GPS devices, cars, toys and even dog collars will all generate data. Enterprises now need to cater for the ?bring your own device? (BYOD) trend, as IT users demand access to every business application on any device.
Big Data in the Digital Universe
So when it comes to Big Data, how is business doing? ?Currently, less than 1% of the world?s data is analysed? (IDC 2014a). EMC sees this as a huge opportunity ? an opportunity to analyse multiple data streams, do new things with IT and derive unique insights, hitherto invisible to business. Data, these days, tends to be unstructured, i.e. documents and text files ? diversely formatted, of uncertain accuracy and unpredictable value, and often demanding real-time attention. To maximise the effectiveness of their Big Data strategy, organisations must implement new technologies and processes to change today?s inflexible data structures and transition to more egalitarian and flexible ?Data Lakes?.
Trend 1: Correlation
Organisations will need to derive unique insights from dependent, correlated data sets through the prism of Big Data. Dependency consists of a statistical relationship between two random variables, and data analytics can uncover relationships between data sets that were previously invisible. For example, recently during the ?Used Car Defect Prediction Contest? hosted by San Francisco online Startup Kaggle, a spate of analyses of data sets previously thought to be unrelated was performed by the contestants, and it was unearthed that of all the cars within the data sets, orange cars proportionally had half the chance of being defective (Wohlsen 2012). While this is a simple example, it demonstrates that opportunities for insight abound in almost any organisation. Correlated Data Analysis enables you to see what your competitors can?t and what you otherwise wouldn?t.
Trend 2 Prediction
As organisations find new sources of data and new ways of analysing it, they must move from traditional descriptive analysis to predictive analysis, performed in real time. This trend encompasses a move to self-service business intelligence and analytics, which will enable executives and employees alike to use software tools for data discovery, leading to timely decision making with fewer bottlenecks to action as they move increasingly to become software-defined enterprises. It is these software-defined enterprises that will be the most successful in the era of the ?Third Platform?[[i]] (defined by social mobility, billions of end users and millions of apps).
Trend 3 Telematics
Telematics, or the highly automated communications process by which measurements are made and other data collected at remote end points, subsequently sending data back for analysis, will be an increasingly important driver in the Digital Universe. While there may be a finite number of things that can be computerised and measured, ?this number is already approaching 200 billion. Furthermore, there are already 50 billion sensors that measure this information, with scientists predicting a trillion-sensor network within the next 10 years? (IDC 2014a).
What does this mean for IT Pros?
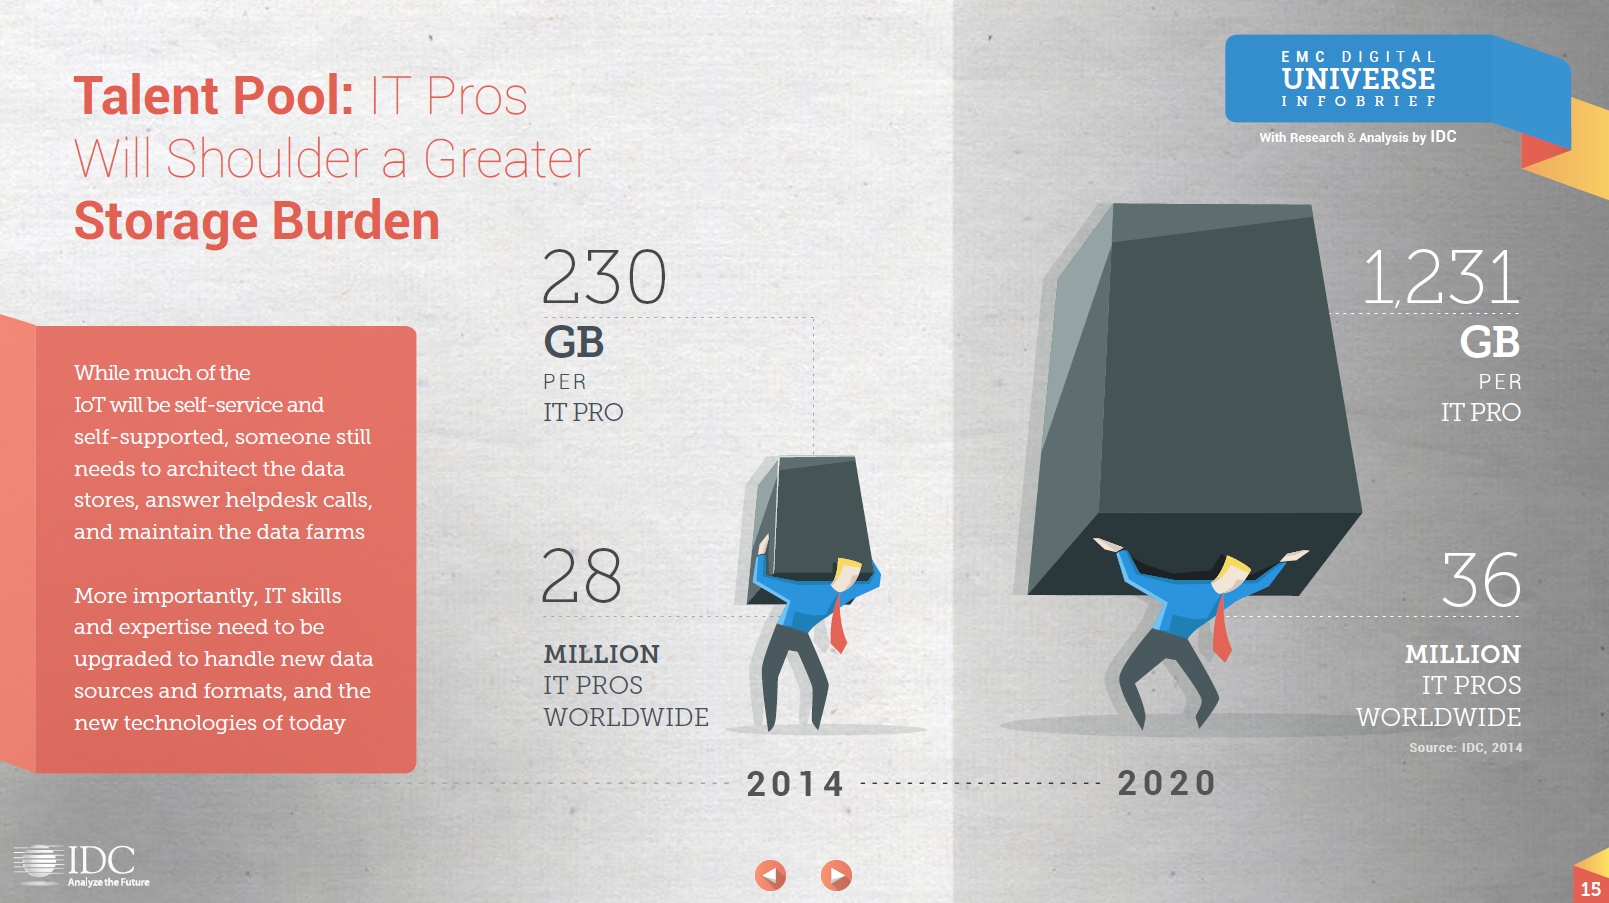
While it can be said with a high degree of certainty that much of the IoT will be self-service and self-supported, someone will still need to architect the data stores, answer help desk calls and maintain the data farms. More importantly, IT skills and expertise will need to be developed to handle new data sources, formats and new technologies while IT budgets continue to shrink and CIOs are asked to do more with less. IT pros will have shoulder the storage burden that all this new data will create. In 2014 on average, ?28 million IT Pros worldwide managed 230 GB of data per person, per year. In 2020, 36 million IT Pros will be expected to manage 1,231 GB of data per person year, and organisations will have to provide them with the tools and skills to manage and make sense of it? (IDC 2014b). This trend is shown graphically in Figure 2 below.
Figure 2 ? Trend in IT storage per IT worker. Source: (IDC 2014b: 15)
Data Lake
Data traditionally fell into two buckets. Bucket One included utilised data, and Bucket Two consisted of new types of data, or data that the organisation may have already had, but which was not utilised for business purposes. In other words, these two data types can be referred to as structured and unstructured data. Traditional architectures, whereby storage pools attached to legacy applications would have to import structured data into a data warehouse, are insufficient for the modern age in two key ways. They have no ability to analyse unstructured data, and the data analysis they can perform takes too long to be of use, due to ETL (or ?extract, transform and load?) to the Data Warehouse. In order to combat this problem, a new architecture was needed. Enter, the ?Data Lake?[[ii]].
Modern Data Lakes provide a new architecture for better managing and analysing massive amounts of data. Not only do they deliver superior performance via innovations such as ?In-Memory Compute?, but if they are architected properly, they will be open source?based (Hadoop) and leverage NOSQL (which originated from the term ?not only SQL? and describes databases that are ?schema-less?, meaning that they can be easily restructured and changed) providing simplicity of design, horizontal scaling and finer control over availability. Add a Data Scientist to the mix and all sorts of pertinent information can be extracted from both structured and unstructured data.
Evolving Role of Information Security and Data Protection
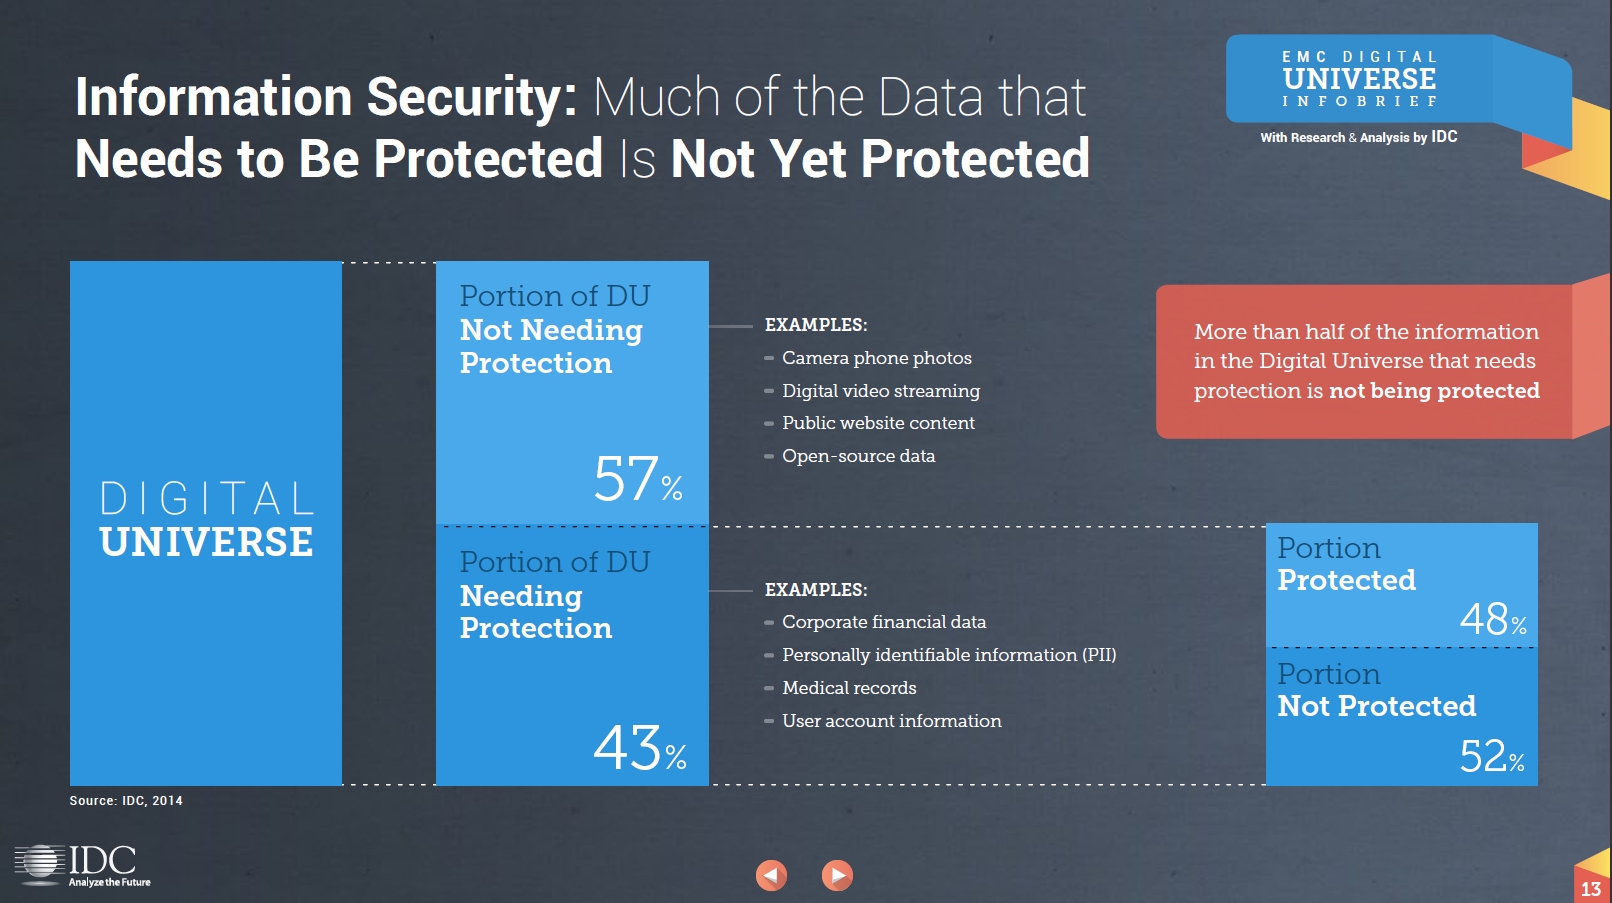
As the Digital Universe evolves and grows, businesses face increasing challenges in the domains of Information Security, Data Protection and Disaster Recovery. According to current data, ?43% of the Digital Universe requires some level of data protection. Here we?re talking about corporate financial data, personally identifiable information (PII), medical records and user account information. 57% does not generally require data protection, for instance camera phone photos, digital video streaming data (i.e. the subset of video that doesn?t need protection ? for example, open YouTube videos and open data on blogs) public website content, and open-source data? (IDC 2014b). Surprisingly, or perhaps not given shrinking IT budgets, more than half of all the information that requires data protection is not currently protected (see Figure 3). This leaves many companies at risk of incurring critical data losses resulting in system downtime, customer turnover, in some cases irreparable damage to their brand and ultimately loss of revenue. The recent media storm and resultant resignation of Target?s CIO following a data breach speak volumes about the potential risks CIOs face when their data is insufficiently protected and vulnerable to attack.
Figure 3 ? Current level of data protection. Source: (IDU 2014b: 13)
Changing our Approach to Securing Information
In years gone by, the role of Security was one of prevention. Signature-based and IT-controlled perimeters protected enterprise infrastructures from attacks and for a time, served their purpose well. This was the age of the 2nd Platform, an age in which end users consumed Enterprise IT via the tried and tested means of LAN/Internet and Client/Server. In the Digital Universe, establishing a secure perimeter is no longer a possibility, and organisations must evolve their IT Security Strategy from one of prevention to one of detection. Over the years, threats have evolved from simple worms, viruses, DDoS attacks and phishing/pharming emails, progressing to the now almost ubiquitous advanced persistent threats, multi-stage threats and ?hacktivists? that enterprise organisations must deal with on an almost daily basis. Not only are cyber criminals now more sophisticated in their approaches, but the surface area of attack has never been greater. In 2007 most enterprises had just a handful of web-facing applications; a web site, maybe a customer support portal.
Today we are in the world of ?there?s an app for that? with a huge proliferation of small apps that often come and go in a matter of months, and which can easily be built by non-IT users to access sensitive information from any device. By 2020 we?ll be connecting these apps and smart-connected devices to more and more of our big data systems, all of which means more points of entry for those with nefarious intent. In order to detect threats early, Big Data and Security Systems must work hand in hand to alert, report, investigate, analyse, visualise and respond to threats in a timely manner ? thereby providing organisations with public and private threat intelligence and ensuring data governance.
Next Generation Applications
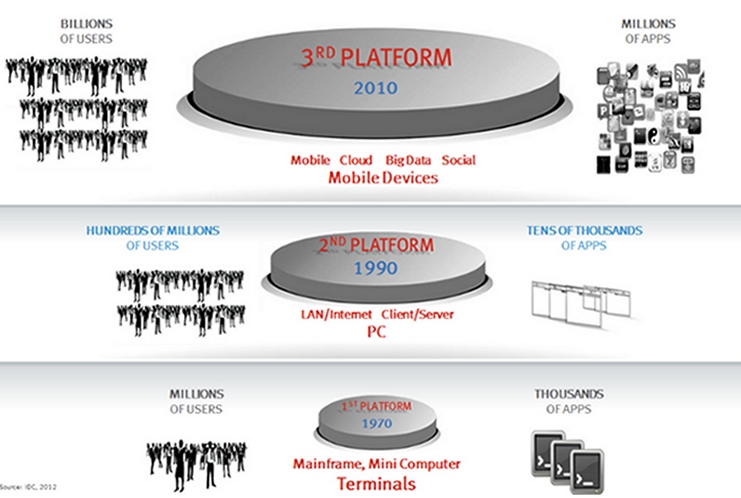
As IT moves towards the Hybrid Cloud ? built upon the Third Platform (see Figure 4 below) which is set to realise a 700% growth in applications by 2016 from the amount in existence in 2013 and is based upon the mega trends of Mobile, Cloud, Big Data and Social Media) ? new applications are needed, applications that service billions of users while being data-loss-tolerant, HDFS/Object storage-compatible, and which provide software-based resiliency. Not only that, the way applications are developed is changing, as Platform as a Service (PaaS) becomes the application development framework of choice.
Historically, applications were developed according to the waterfall method with tools such as Java, COBOL and PL1. Now, under the PaaS framework, applications can be rapidly ?stood up?, enabling businesses to respond to changing markets and competitive landscapes, to provide users with new functions, features and ultimately ? value ? in record time. PaaS is based on what Pivotal calls the virtuous cycle, consisting of applications, data and analytics. Here?s how it works: Apps power businesses, and those apps generate data. Analytical insights from that data drive new app functionality, which in-turn drives new data and insight. The faster you can move around that cycle, the faster you learn, innovate and pull away from the competition, and that?s where the tools and libraries inherent in PaaS deliver agility ? enabling you to facilitate rapid service or application development without the cost and complexity of buying and managing the underlying hardware or software, and without the need to provision hosting capabilities.
Figure 4 ? The ?Third Platform? for data storage.
Conclusions/Recommendations
In order to meet the demands of the Digital Universe, organisations must rethink the way that data is collected, stored, analysed and acted upon. The disruptive technologies of Cloud, Big Data, Mobility and the IoT, combined with exponential data growth, are already changing the IT landscape and stretching IT resources and budgets. Organisations must leverage flexible architectures and platforms without falling into the trap of vendor lock-in, while at the same time ensuring data governance and compliance in a world where preventative security is no longer an option.
Organisations that flourish in this changing environment will be software-defined ? leveraging best-of-breed, horizontally architected solutions that provide them with choice. Choice means the ability to sweat existing single or multi-vendor assets with seamless interoperability, while being able to upgrade or update hardware, software and applications to meet changing market demands with ease, agility and strategic insight. Today?s software-defined enterprise must be based on Cloud, Big Data and Trust. Those that adopt and adapt early will be best positioned get ahead and stay ahead of the curve.
References
IDC 2014a. Turner. V; Reinsel. D; Gantz. J; Minton. S. April 2014 ?The Digital Universe of Opportunities: Rich Data and the Increasing Value of the Internet of Things? IDC Whitepaper.
IDC 2014b. Turner. V; Reinsel. D; Gantz. J; Minton. S. April 2014 ?The Digital Universe of Opportunities: Rich Data and the Increasing Value of the Internet of Things? EMC Infobrief with research and analysis by IDC.
Wohlsen, Marcus. 2012. ?San Francisco startup make [sic] data science a sport?, Yahoo News, 4 April 2012, at http://news.yahoo.com/san-francisco-startup-data-science-sport-211334695.html
Endnotes
[i] The third platform is a term coined by IDC which defines the technology trend towards building applications that run on mobile devices, are built on the Cloud, in many cases leverage Big Data repositories and often connect to social networks. The first platform that we built in the 70s and 80s, was largely a centralised mainframe and mini-compute platform that connected thousands of applications to millions of users. The second platform emerged as a distributed, PC client/server architecture that saw hundreds of millions of users connect to tens of thousands or apps. Today we are building the potential to connect any person on the planet to millions of applications. As we have moved to each new platform, the technology has become more decentralised and the potential to harness and gain insight to information has increased.
